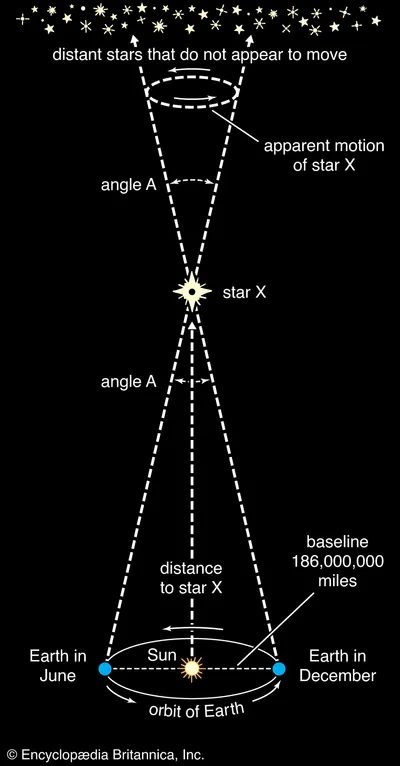
Look at your thumb. Hold it up at arm’s length. Close one eye. Now switch. Your thumb seems to jump against the background. That shift is parallax. It’s simple geometry. It’s also the foundational tool for mapping the universe.
In astronomy, parallax is the apparent shift in a celestial object’s position when viewed from two different locations. By measuring this angle, scientists can calculate distances with remarkable precision. The method relies on a basic triangle. You have the observer. You have the object. You have the base line connecting the two viewing points. If you know the length of that base and measure the angles, you can solve for the distance to the object.
Geocentric vs. Heliocentric Measurements
The definition of the “base line” changes depending on where the object is. For bodies within our solar system, astronomers use the Earth itself. They measure the object from two widely separated points on the planet’s surface. This is geocentric parallax. It works well for the Moon and the Sun.
For everything else? The scale gets bigger. The baseline expands to the entire width of Earth’s orbit around the Sun. This is heliocentric parallax. We wait six months. We observe a star from opposite sides of the orbit. The baseline is now 186 million miles wide. The shift is tiny. But it exists.
The Limits of Direct Measurement
How small is this shift? For Alpha Centauri, the nearest star system, the parallax is 0.75 arcseconds. That is a fraction of a single degree. It is incredibly small.
Direct measurement hits a hard ceiling. The smallest parallax we can measure directly with current technology is about 25 times smaller than Alpha Centauri’s shift. Beyond that, uncertainty creeps in. We cannot trust the numbers anymore.
So what happens when we need to measure stars further out? We stop relying on direct observation. We use indirect methods. These methods still rely on the principle that parallax is inversely proportional to distance. The farther away the object, the smaller the angle. But the error margins grow. The certainty shrinks. We are calculating distances into the deep dark, guided by math rather than direct sight.
Why This Matters
Why do we care about such tiny angles? Because distance is the first step to understanding everything else. You cannot know how bright a star is unless you know how far away it is. You cannot gauge its size. You cannot determine its age. Parallax provides the anchor. Without it, the universe remains a flat, incomprehensible sheet of light. With it, we get depth. We get scale.
The measurement of stellar parallax is not just a technical exercise. It is the primary rung on the cosmic distance ladder. Every other method of measuring the universe builds on the foundation laid by these triangles. We start here. We start with the nearest stars. We start with what we can see shifting in the night sky.
It is a fragile process. One wrong angle. One miscalculation. The whole map distorts. But for now, the geometry holds. The stars are exactly where we say they are. Or at least, as close as we can get.

The Geometry of Distance
Look up. The moon isn’t where it looks like it is. At least not quite.
This isn’t a trick of the light or a flaw in your vision. It’s geometry. Specifically, it’s parallax.
When we talk about the parallax of the Sun or Moon, we are talking about the difference in direction. Your eyes see one thing. Earth’s center sees another.
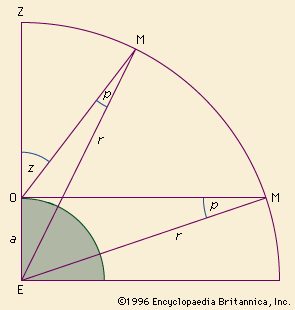
The parallax of the Sun or Moon is defined as the difference in direction as seen from the observer and from Earth’s centre.
Let’s map it out.
You are standing on the surface of the Earth. Point O.
The center of the Earth is point E.
The Moon is somewhere up there. Point M.
The angle OME? That’s the parallax.
It moves. It breathes with the sky.
If the Moon is directly overhead. Zenith. Directly above your head. The parallax is zero. You and the center of the Earth are on the same line.
But when the Moon drops to the horizon? That’s where it hits its peak. The angle widens. The shift is greatest.
There is a formula for this. A simple triangle.
O is you.
E is the center.
M is the Moon.
If z is the angular distance from the zenith…
Then sin p = a /r sin z.
Simple math.
When z is 90 degrees… when the body is on the horizon…
sin p = a /r.
This value has a name. Horizontal parallax.
We usually just call it the parallax.
For stars. For planets. The angle p is so small it barely registers. It doesn’t differ appreciably from sin p. We express it in angular measure. Tiny fractions of a degree.
But the Moon? The Moon matters.
The Shape of the Problem
Here is where it gets messy.
The Earth isn’t a ball.
It’s a spheroid. Puffed out at the equator. Flattened at the poles.
This shape breaks the simple triangle.
So the definitions of lunar and solar parallax need refinement. You can’t just measure from the center to the surface and assume a perfect sphere.
The numbers you see in textbooks? The values generally given?
They aren’t random.
They are equatorial horizontal parallax.
Why the equator? Because that’s where the radius a is largest. The bulge makes the angle bigger. It’s the maximum possible shift.
If you are in London. Or New York. Your parallax is slightly less than the equatorial value.
Solar Parallax and the Cosmic Ruler
The Sun is far away. Too far for this triangle to work directly.
We can’t stand on the surface and measure the angle to the Sun’s center with a protractor.
So we cheat.
We use other bodies.
Asteroids. Venus. Mars. Planets that come closer. We measure their positions relative to the stars. We track their movement. We use them as stepping stones.
From these measurements… we derive the solar parallax.
It’s a chain reaction.
Measure Mars.
Calculate

Measuring the Moon: From Ancient Angles to Modern Gravity
Hipparchus got his first big win in 150 bce. He decided to measure the parallax of the Moon. It was the nearest celestial body. Easy target. He calculated a parallax of 58 arcminutes. That placed the Moon at roughly 59 times the Earth’s equatorial radius. Modern measurements say it’s 57′02.6″. That’s a mean distance of 60.2 radii. Close enough for ancient math.
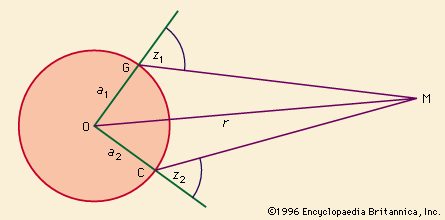
How do you measure this today? You use two spots nearly on the same meridian. Greenwich. The Cape of Good Hope. Observers there measure angles z 1 and z 2. They plug in the latitudes. They use the known size and shape of Earth. It’s geometry. Real geometry.
But there is noise. Refraction messes with the light. Instruments have their own quirks. So astronomers watch stars near the Moon too. They compare the Moon to the background. It cancels out the errors. Clean data.
Lunar parallax is directly determined from observations made at two places, such as G, Greenwich, Eng., and C, the Cape of Good Hope, that are nearly on the same meridian.
The Gravitational Shortcut
There is another way. It ignores angles. It uses gravity. Compare the force at Earth’s surface with its pull on the Moon.
If M and m are the masses of Earth and the Moon. If r is the mean distance. If P is the sidereal period. And G is the gravitational constant. Then you have an equation.
G (M + m ) = 4π2r 3/P2
π is 3.14. Simple enough.
Then look at g. The value of gravity at Earth’s surface. You get this from pendulum observations. It equals G M/a 2.
Hence


Measuring the Moon’s Distance
The math is clean. You know the variables on the right side of the equation. That leaves a /r pinned down with serious precision. The result? A lunar parallax of 57′2.7″. It’s a solid number. But how do we actually measure it in the real world?
Radar and laser ranging give us the recent benchmarks. We shoot a signal at the Moon and wait for the bounce. It’s a direct distance check. But the surface isn’t a perfect sphere. Topography throws a wrench in the works. We have to guess at the lunar radius and the center of mass to get the average.
In 1964, the International Astronomical Union settled on 57′02.608″. That corresponds to a mean distance of 384,400 km (238,900 miles). Close enough for government work, or at least, close enough for decades of astronomy.
Solar Parallax
The Sun is harder to pin down. We use trigonometric parallax. The law of gravitation tells us the relative distances of the planets. The Earth-Sun distance becomes our unit of length, the “astronomical unit.” Measure any planet’s distance accurately, and you define that unit.
Smaller distance equals larger parallax. More parallax means higher accuracy. So we look for planets close to Earth. Opposition is key. We need simultaneous observations from different spots on Earth. Or we use the Earth’s rotation as a baseline, measuring before sunrise and after sunset from the same location.
1672 was a turning point. Observations of Mars from Cayenne and Paris yielded 9.5″. It was the first reasonably accurate shot at the Sun’s parallax. But it wasn’t the last word.
Light and Aberration
Velocity of light plays a huge role. We know it with terrifying precision. Ole Rømer’s original method is the inverse here. Use the time light takes to reach us as Jupiter orbits. But accuracy suffers. The variations are too noisy.
Aberration is cleaner. It’s the ratio of Earth’s orbital velocity to light’s velocity. It creates an annual shift of about 20.496″ in star positions. Greenwich observations between 1911 and 1936 gave 20.489″ ± 0.003″. That pointed to a solar parallax of 8.797″ ± 0.013″.
Is it flawless? No. Systematic errors still haunt it.
Spectroscopy and Radar
Stars move toward or away from us. Spectroscopy detects this. By timing Earth’s orbital motion relative to specific stars, we calculate Earth’s speed. Observations from the Cape of Good Hope gave 8.802″ ± 0.004″.
Then radar arrived. Venus became the target. We measure the pulse travel time. Earth-Venus distance becomes clear. From there, the Earth-Sun unit falls into place.
The current accepted value for the astronomical unit is 149,597,871 km (92,955,807 miles). It’s precise. It’s useful. It’s not perfect.
Radar has limits. We rely on planetary orbit models. The speed of light isn’t just a constant; it’s an assumption in the calculation. And plasma between Earth and Venus delays the signal. Electromagnetic effects add noise to the echo.
Gravitational Clues
Gravity offers another path. Lunar theory includes a monthly term called the parallactic inequality. Its coefficient holds the ratio of solar to lunar parallax. The coefficient is large. It’s useful.
Mass ratios matter too. The Earth-Moon combined mass compared to the Sun is determined by how they disturb planetary orbits. The Moon is 1/81.30 the mass of Earth. From that, we get Earth’s mass relative to the Sun.
The solar parallax derives from there. Similar to the lunar method, but scaled up. The numbers converge.
Stellar Parallax
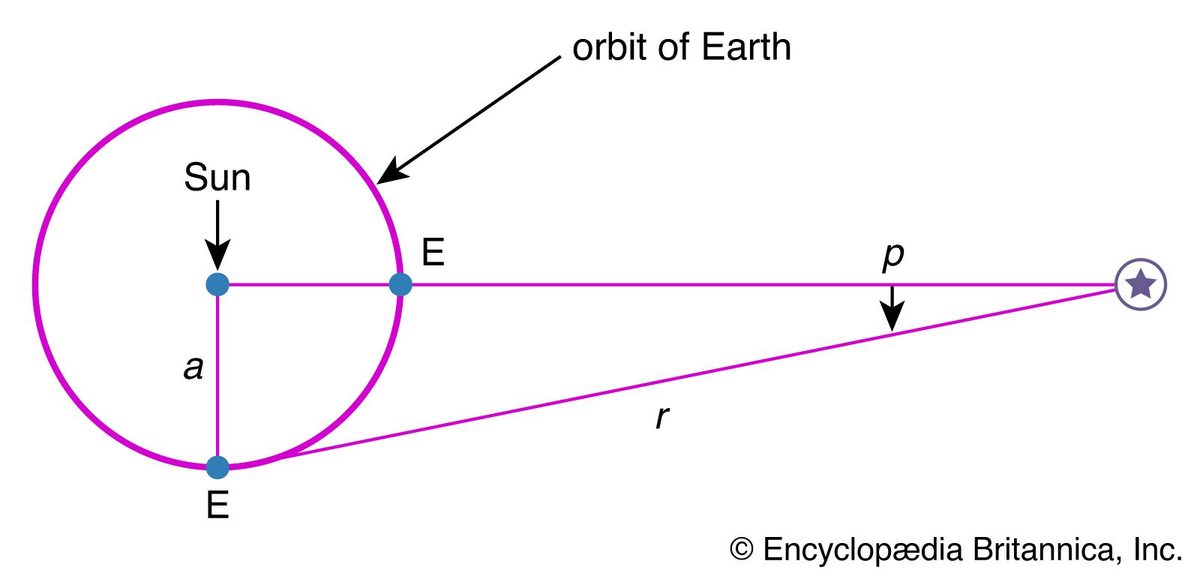

Tracking the Shift
The stars are so far away that standing on opposite sides of Earth doesn’t change your view of them by much. But the Earth isn’t stationary. It orbits the Sun at a distance of 149,600,000 km. This movement changes our vantage point throughout the year. The result is annual parallax. It’s the apparent shift in a star’s position when viewed from Earth versus the Sun.
The size of this shift depends on the time of year. The maximum shift is calculated by dividing the radius of Earth’s orbit (a ) by the star’s distance (r ). The number is tiny. It never exceeds 1/206,265 radians. In sexagesimal measure, that’s just one arcsecond (1″).
The First Measurement
Friedrich Wilhelm Bessel broke the record in 1838. He used a heliometer built by German physicist Joseph von Fraunhofer. The target was 61 Cygni. It’s a faint star, barely visible without aid. It also moves quickly across the sky.
Bessel corrected for that proper motion. He found the star traced an ellipse every year. That back-and-forth wiggle was the annual parallax. Astronomers had suspected this effect for centuries. Bessel proved it accurately for the first time.
His measurement was about one-third of an arcsecond. Today, we know that puts 61 Cygni roughly 10.3 light-years away. Bessel didn’t use light-years then, but the math holds. For context, Alpha Centauri is closer. It’s 4.3 light-years away with a parallax of about 0.75″.
Direct Measurement Techniques
Accuracy improved drastically in 1903. American astronomer Frank Schlesinger introduced photography. The process involves taking photos when the star crosses the meridian after sunset. Then, six months later, you take more photos before sunrise.
Proper motion complicates things. The star keeps moving. You need at least three sets of observations. Schlesinger often took about 25 photographs over five epochs. The probable error dropped to ± 0.010″. This precision matters, even if the star’s photographic disk is 2.0″ wide.
Astronomers use the parsec for these distances. It’s the distance of a star with a parallax of exactly 1″. One parsec equals 206,265 times Earth’s distance from the Sun. That’s about 30 trillion kilometers. Or 3.26 light-years.
The formula is simple: d = 1/p. If p is in arcseconds and d is in parsecs, the math is direct.
Alpha Centauri has the largest known parallax at 0.75″. Within five parsecs of the Sun, there are 74 known stars. Sirius and Procyon are in that group. Most are faint objects you need a telescope to see.
Indirect Measurement
Trigonometry fails beyond 1,000 parsecs. The angle drops to 0.001″. It’s too small for accurate measurement. Other methods are needed.
You can derive parallax from apparent magnitude. But you need to know the absolute magnitude. This is how bright the star would be at 10 parsecs. Spectral types help estimate this. Proper motion data helps too. The connection between absolute magnitude (M ), apparent magnitude (m ), and parallax (p ) is established by a specific formula.


The fundamental rule governing starlight is unforgiving: brightness drops off as the square of the distance increases. Double the distance? The star appears four times dimmer. This inverse-square law is the anchor for almost everything we do when trying to map the universe, but knowing the distance requires knowing how far away something is to begin with. For most stars, we can’t just stick a ruler in space. We have to deduce it.
Moving Clusters as Geometric Proxies
Not all stars are stationary drifters. Some move in packs. Think of the Hyades cluster in Taurus or the stars forming the handle of the Big Dipper (Ursa Major). These are moving clusters. They aren’t actually converging on a single point in space. That’s an optical illusion.
It’s perspective. Imagine standing on a long, straight highway watching cars drive away from you in parallel lanes. To your eyes, they seem to merge at a vanishing point on the horizon. Stars do the same thing across the celestial sphere. Their parallel motion creates a “convergent point.”
Once astronomers pinpoint that direction and measure a star’s proper motion (how it moves across our line of sight) and its radial motion (speed toward or away from us), the geometry solves itself. The parallax falls out of the triangle. It’s a clever workaround for stars too far for traditional trigonometric methods.
The Solar Apex and Mean Parallaxes
Our own solar system isn’t sitting still. We are careening through the galaxy at 13.4 km/s. That’s fast enough to cover three astronomical units (the distance from Earth to the Sun) every single year. This creates a “apex” in the sky—the direction we are heading.
Stars appear to drift away from this apex. If every star were perfectly stationary, this drift would be a direct map of their distances. But stars have their own “peculiar” motions. They zigs and zags. So, we can’t trust individual stars. We have to average them out.
By assuming the peculiar motions of a large group cancel each other out, we can calculate a mean stellar parallax. It’s not exact for one star, but it’s statistically robust for a crowd.
We’ve done this for groups by brightness and type. Fifth-magnitude stars (visible to the naked eye) have a mean parallax of 0.018 arcseconds. Ten-magnitude stars, which are roughly 1/100th as bright as fifth-magnitude ones, sit at 0.0027 arcseconds. The math holds up: dimmer stars are generally further away.
Spectroscopic Clues: Reading the Light
Sometimes we don’t need geometry. We just need physics. The spectra of almost all stars fit into a neat sequence based on surface temperature. The Henry Draper (HD) classification uses letters O, B, A, F, G, K, and M (with L and T added later for cooler objects).
O-type stars are scorching, around 50,000 Kelvin. M-type stars are relatively cool, and the newer L and T classifications drop down to about 800 Kelvin. This system is usually refined with decimal subdivisions for precision.
But temperature isn’t the only clue. In 1914, Walter Adams and Arnold Kohlschütter noticed something odd. Stars of the same spectral type didn’t always look the same in their spectra. The subtle differences in spectral lines depended on the star’s density and size. Giants had broad, faint lines. Dwarfs had sharp, narrow ones.
This was the breakthrough for spectroscopic parallax. By identifying whether a star is a giant or a dwarf based on its spectrum, we can estimate its intrinsic brightness (absolute magnitude). Compare that to how bright it looks from Earth (apparent magnitude), and the distance follows. We apply this to most bright stars in the Northern Hemisphere, using stars with known geometric parallaxes as our calibration standards.
The MK System and Photometric Precision
The spectroscopic method needed refinement. Enter the MK system. It’s a two-dimensional classification that stuck universally. It keeps the Draper temperature classes but adds five luminosity classes, labeled with Roman numerals I through V.
- I: Supergiants
- II: Bright giants
- III: Giants
- IV: Subgiants
- V: Main sequence dwarfs
This system looks at spectral lines most sensitive to surface gravity. Once a star is placed in a luminosity class, its absolute magnitude is known.
Color provides another route. Ejnar Hertzsprung figured this out in the early 1900s. The color of a star is a measure of its temperature, but it’s also correlated with its luminosity. We measure “colour index”—the difference in brightness between two wavelength bands.
Today, we use the UBV system. It measures light in ultraviolet (U), blue (B), and yellow/visual (V) bands. By plotting the U-B and B-V indices against the MK spectral and luminosity classes, we get a precise calibration.
This relationship is critical for photometric parallax. We look at a galactic cluster. We identify the main-sequence stars. We measure their color and apparent magnitude. Because we know where main-sequence stars should be on the brightness scale based on their color, we can deduce their distance. It’s a powerful tool for mapping clusters across the galaxy.
Binary Stars and the Mass Dilemma
Then there are binaries. Visual binaries allow us to watch two stars orbit each other. If we know the relative orbit, we have a direct link between mass, distance, and time.
The formula connects the combined mass (M, in solar masses), the orbital period (P, in years), the semimajor axis of the relative orbit in arcseconds (a ), and the parallax (p ):
$$p = \frac{a}{\sqrt{M P^2}}$$
We know a. We know P. We don’t know M.
Here’s the weird thing: mass is forgiving. If you get the mass wrong, the error in parallax is dampened by the square root. Crank up the assumed mass by a factor of eight, and the calculated parallax only drops by half. That’s a lot of uncertainty for a small error in the final number.
So, when the mass is unknown, astronomers often assume M equals one solar mass. The resulting distance is called the “hypothetical parallax.” It’s a placeholder. A best guess. But it gets us in the ballpark, and in astronomy, getting close is often as good as getting exact.
The Math Behind the Invisible Orbit
Most binary star pairs we observe are incomplete stories. The orbit isn’t finished. We haven’t seen the full loop. This creates a problem for astronomers. How do you calculate distance when the data is fragmented?
The solution lies in a specific formula. It uses two variables. First, s. This is the apparent separation in seconds of arc. Second, ω (omega). This represents the relative motion in seconds of arc per year.
Combine them. Apply the coefficient. You get p.
p = 0.418 √(s ω²)
This p is a hypothetical parallax. It is a guess based on motion alone. But motion isn’t everything. Mass matters. Luminosity matters.
Here is where the spectral type changes the game. If you know the star’s spectrum, you know its mass and brightness relationship. This allows for a correction factor. You adjust the initial guess. The result is a dynamical parallax.
It is more accurate. It is not just a geometric projection. It is a physical reality. The stars weigh what they look like they weigh.